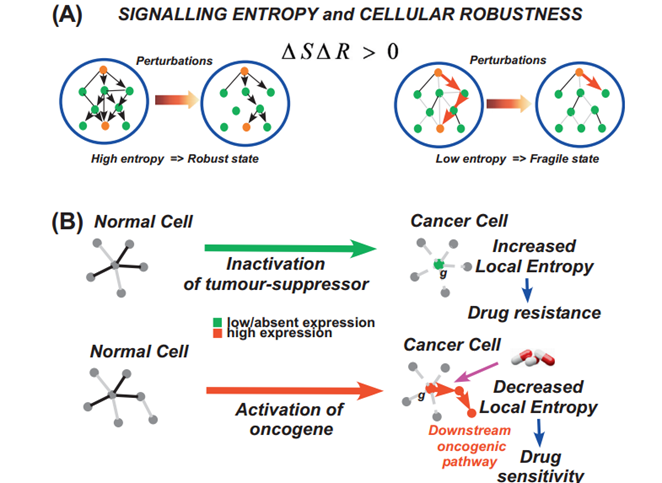
Signalling Entropy
we will describe one approach which does it at the level of individual samples, in which case the gene expression data must be positively valued (e.g. the expression data must derive from Affy, Illumina or RNA-Seq count data) and the mass action principle is used to construct the sto chastic matrix over the network..
Citation
Teschendorff, Andrew E, Peter Sollich, and Reimer Kuehn. 2014. "Signalling entropy: A novel network-theoretical framework for systems analysis and interpretation of functional omic data." Methods 67 (3): 282.
DESCRIPTION OF FILES:
1) dataSCM2.Rd: R data object file containing gene expression data matrix, avdataSCM2.m, from the stem cell matrix 2 compendium. Matrix is of size ~17000 genes X 191 samples. The type of cell (i.e hESC=1, iPSC=2 or somatic differentiated=3) is indicated in the phenoSCM2.lv[[1]] entry. Rownames of expression data matrix annotated to Entrez gene IDs.
2) hprdAsigH-13Jun12.Rd: R data object file with a model of PPI network specified by the adjacency matrix hprdAsigH.m. Rownames annotated to Entrez gene IDs.
3) sr.Rd: an auxiliary R object file needed to run the vignette.
4) DoIntegPIN.R: R-function to perform integration of a PPI network with a gene expression data matrix, extracting the maximally connected subnetwork.
5) CompSR.R: R-function to compute the entropy rate plus auxiliary functions.
6) CompSRana.R: R-function to compute the entropy rate analytically assuming detgailed balance (this will speed up the computation).
7) sigent.pdf: vignette/manual pdf.